

Fulfillment center traffic flow redesign
Solo internal project | Service design | Jan 2026
Using my first-hand experience with Chewy’s fast-paced and complex systems, I redesigned traffic flow and quality control across four iterations.
Impact: 33% staffing cost reduction, 58% quality improvement, 35% throughput increase
📌 TL;DR
Problem: Leadership mandated separating powered industrial equipment from electric tugger cart traffic—created chaos, confusion, and 40% shift quality scores
Solution: 4 iterations from verbal instructions → 5S tape → strategic signage → direct conveyor delivery
Impact:
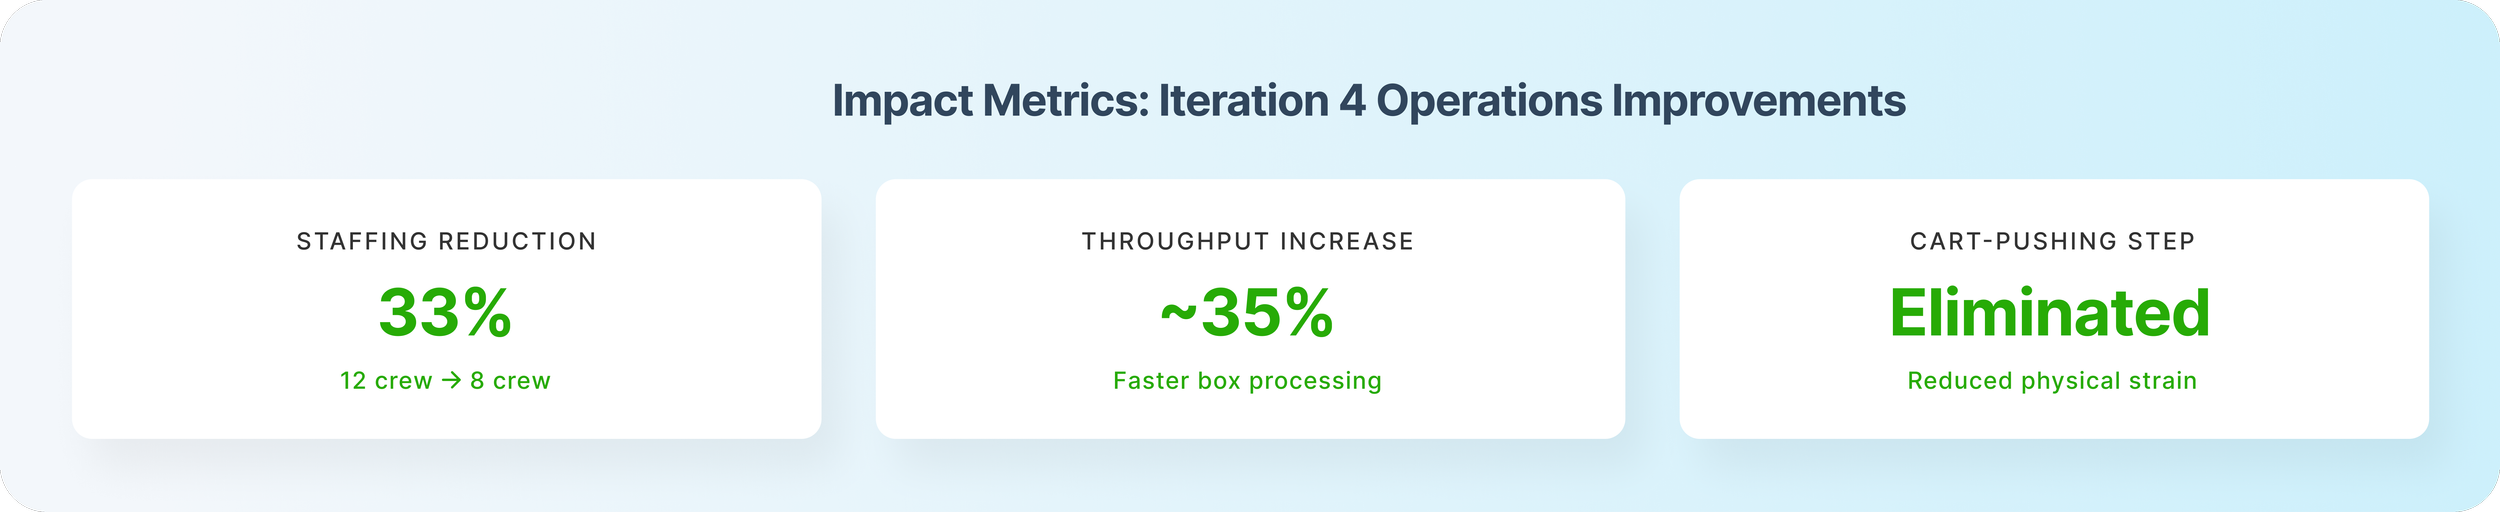
• 33% staffing reduction (12 crew → 8 crew)
• 58% quality improvement (40% → 63% passing)
• 35% faster staging throughput
My Role: Owned iterations 3-4 (signage system design + batched quality audit framework)
OVERVIEW
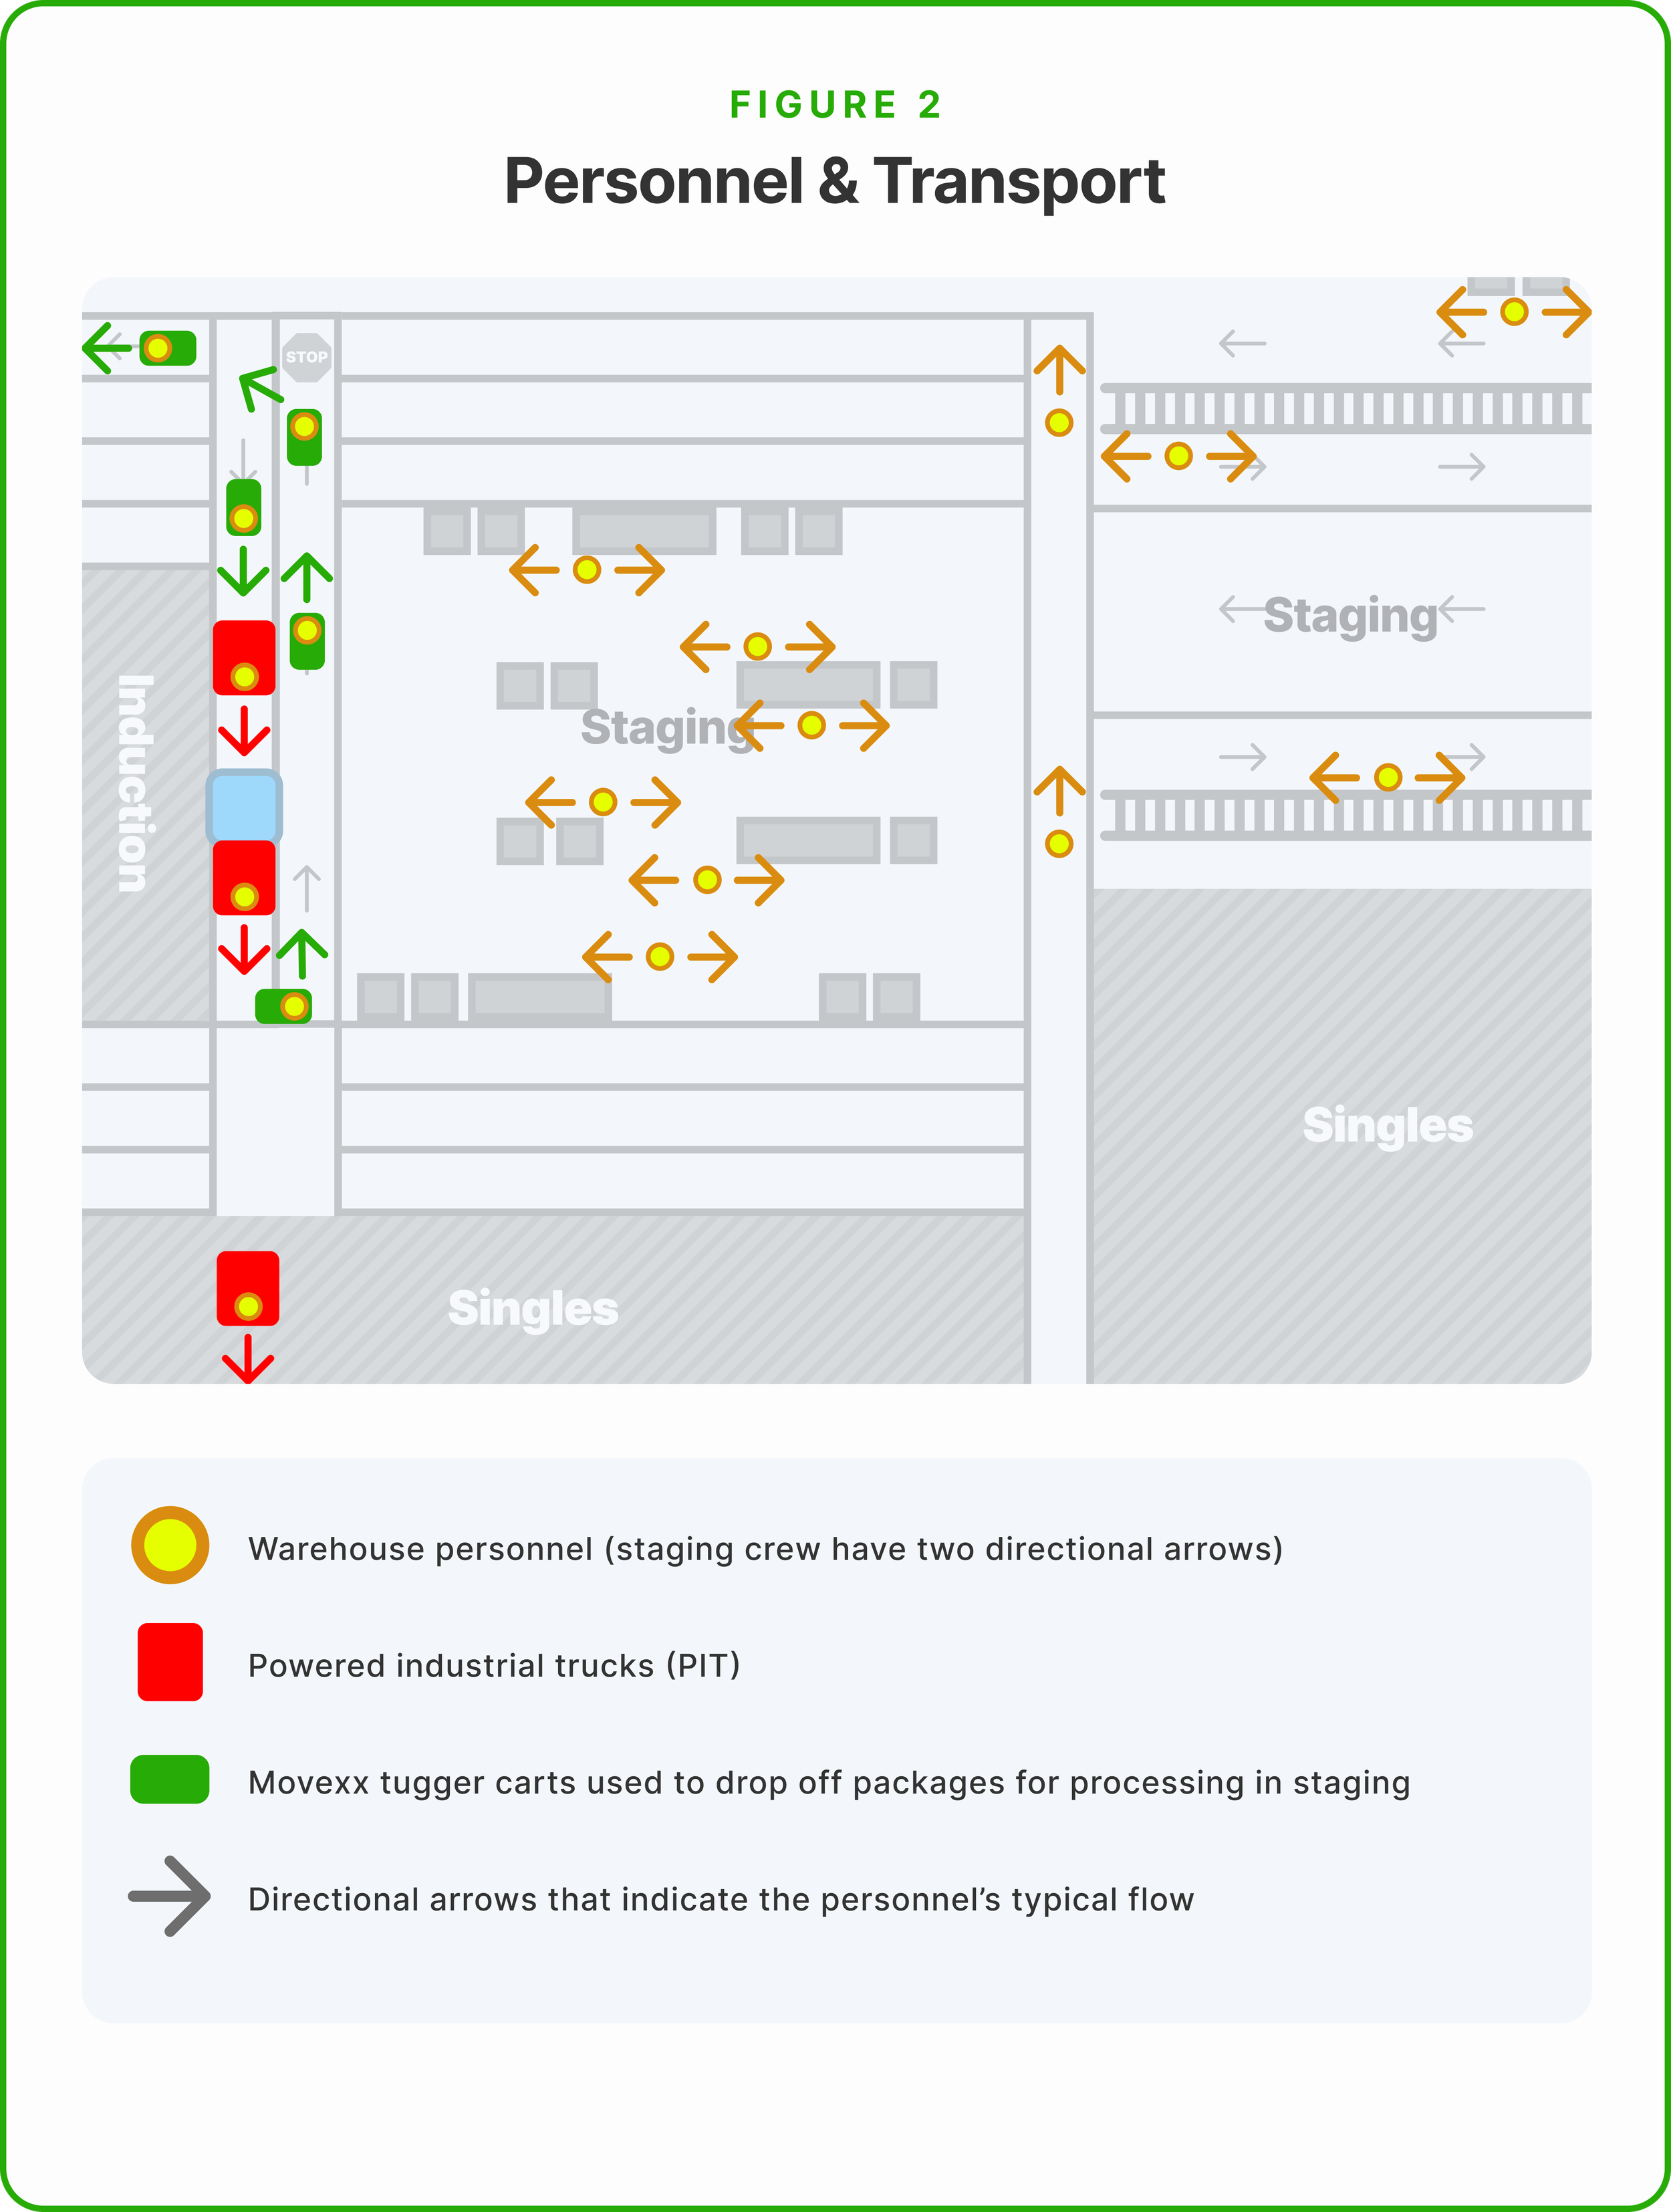
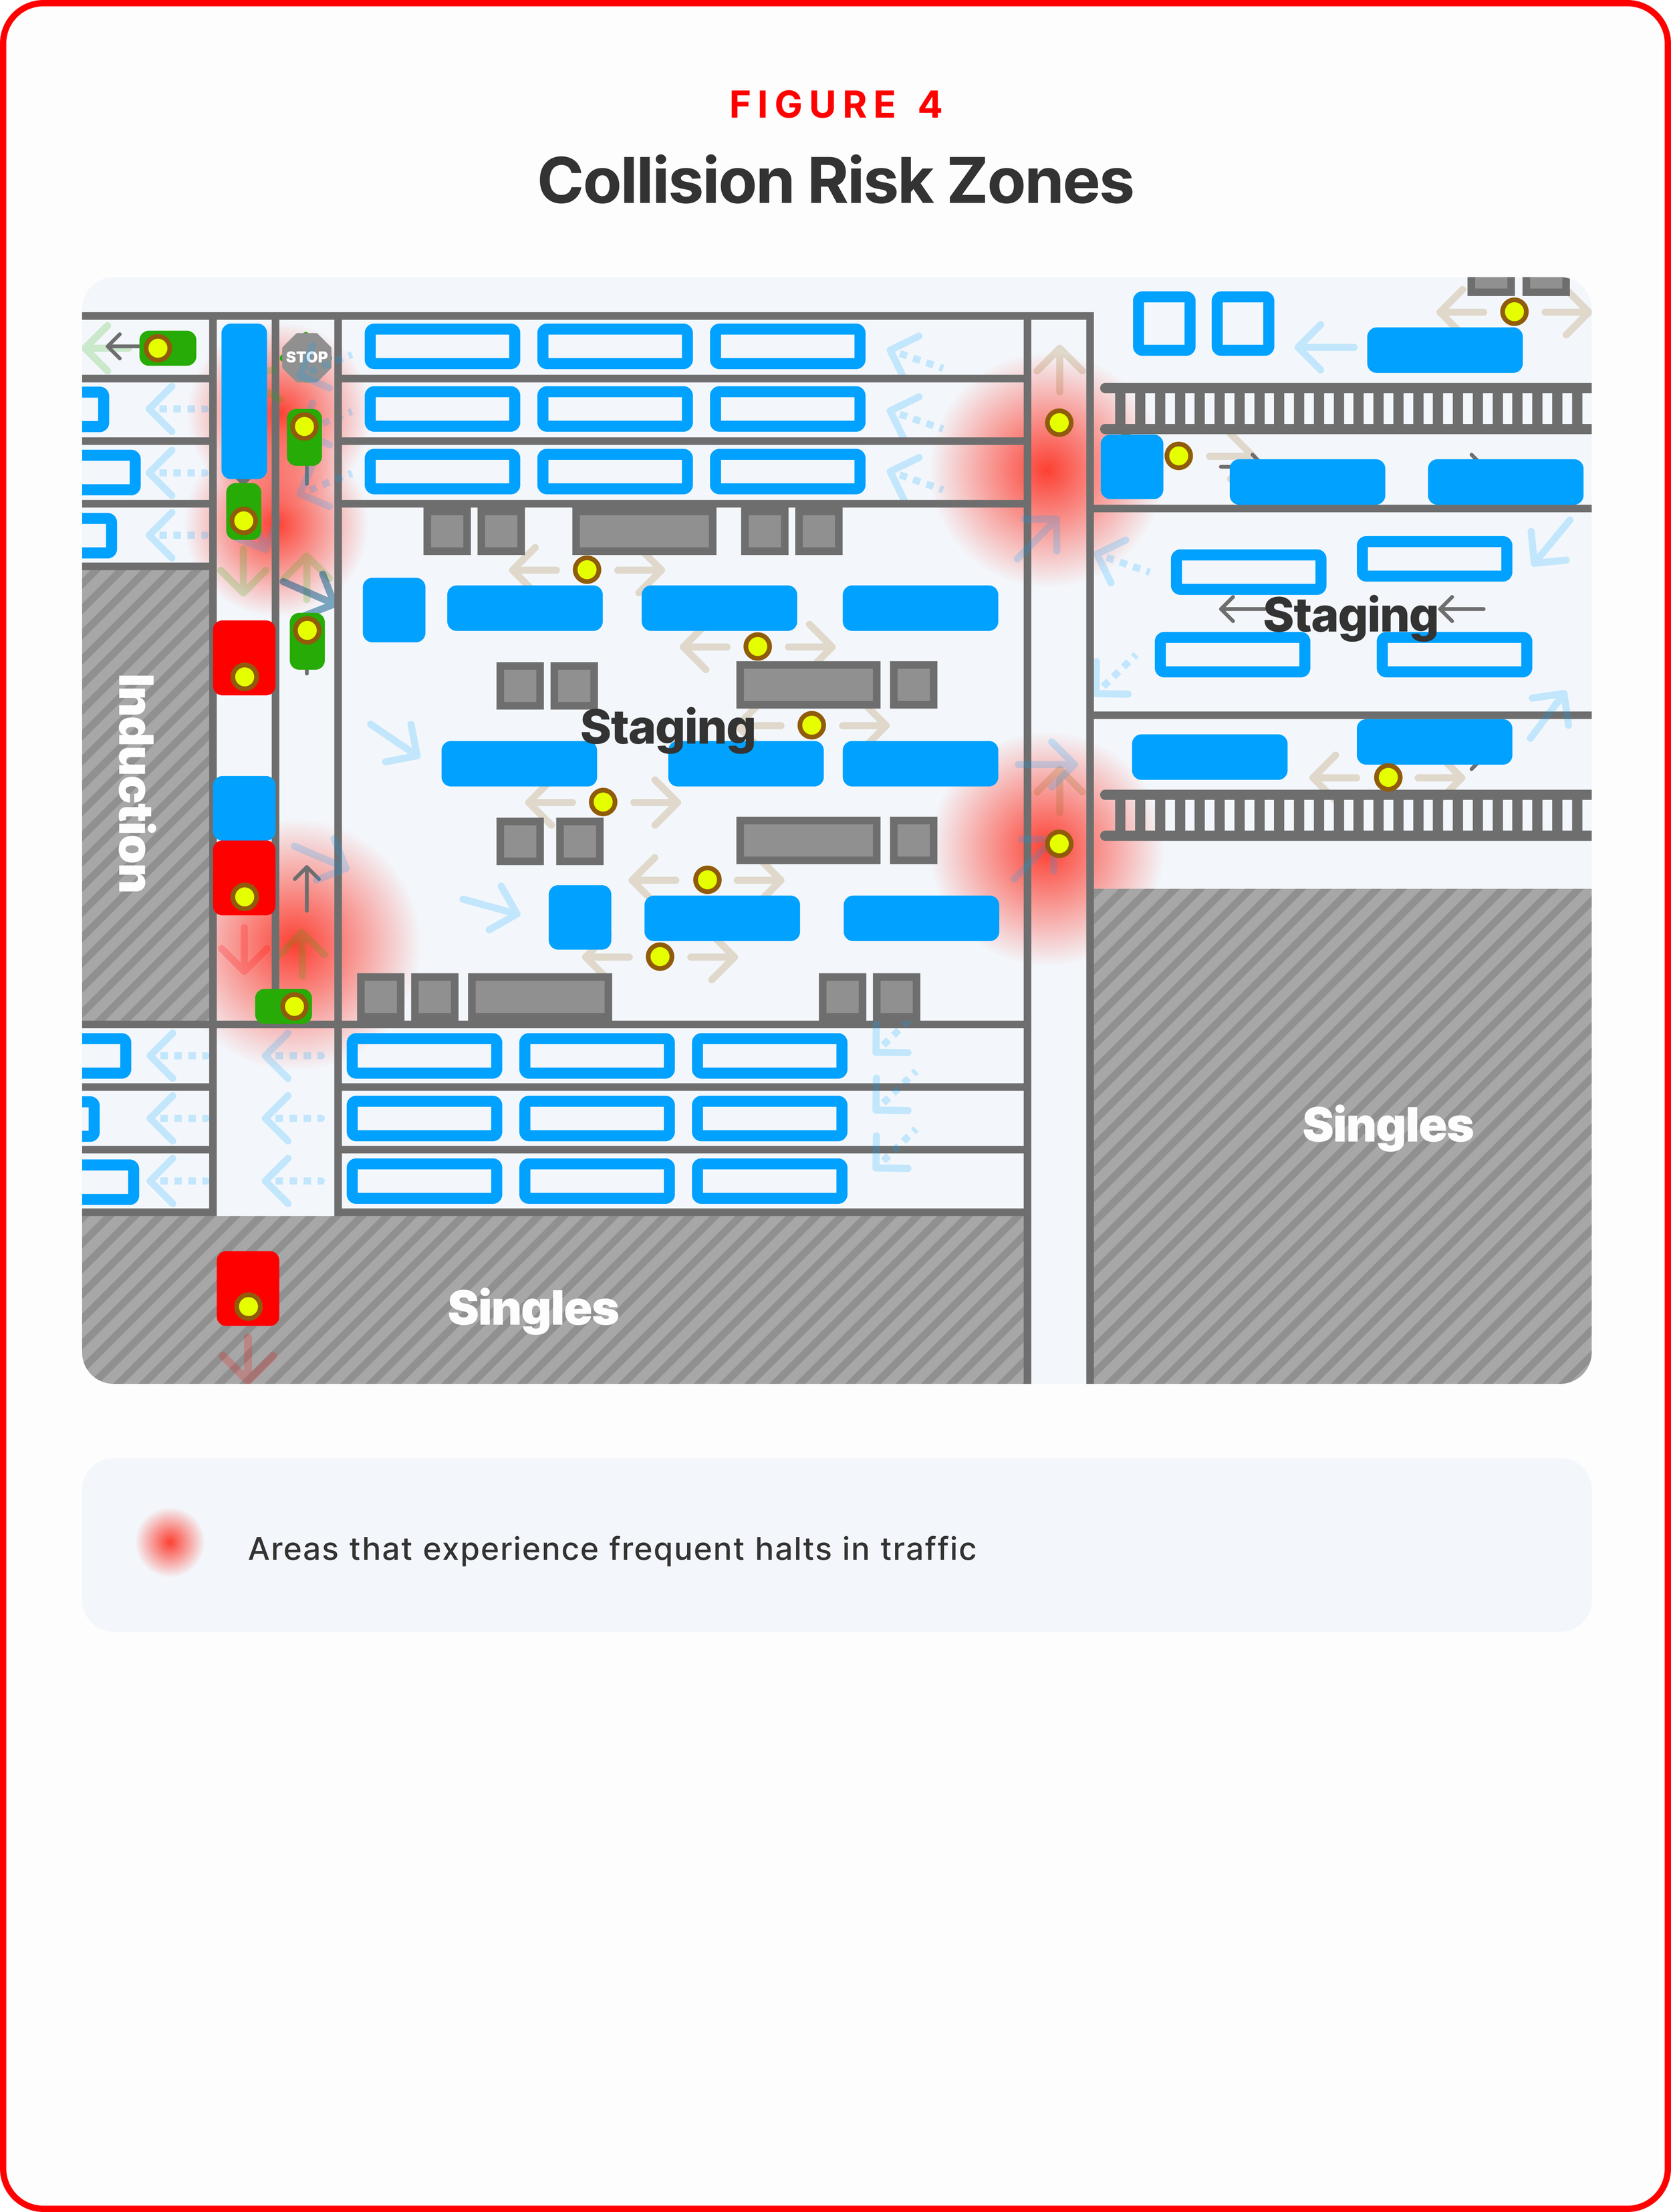
Senior leadership mandated separating powered industrial trucks (PITs) from Movexx cart traffic in staging—a safety-driven decision that made sense on paper. But the initial implementation created chaos: confused team members, traffic jams, and plummeting quality as boxes moved through staging 35% faster without adequate checks.
I redesigned staging's traffic flow across four iterations, culminating in a system that reduced staging staffing by 33% while improving quality scores from 40% passing to 63% passing. I also designed a batched cart audit system that monitored 30-40 carts and caught before they reached customers—preventing an estimated 15-20% of potential customer concessions.
Key Results:
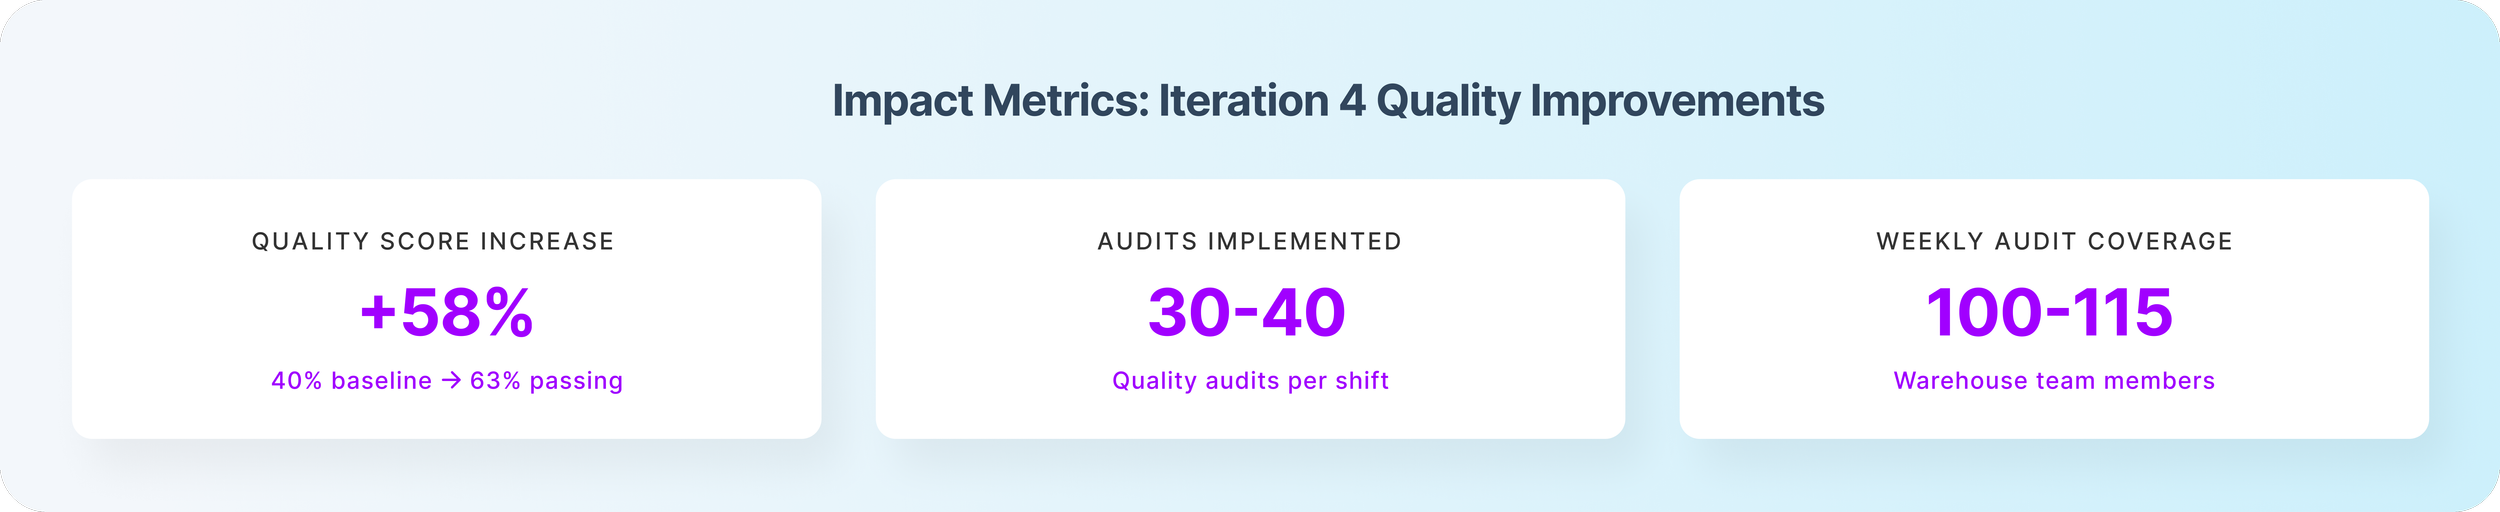
58% improvement in quality pass rate (40% → 63%)
33% staffing reduction enabled by process efficiency gains
Self-sustaining system that worked across all shifts even after I left
30-40 quality audits per shift, covering 100-115 unique team members weekly
🚨 THE CHALLENGE
The Mandate Without Implementation Guidance
Senior leadership (General Manager + Senior Operations Manager) issued a directive in late November 2025: separate Movexx traffic (multis pickers with rolling carts) from PIT traffic (singles team members on forklifts) to reduce collision risk. This was a legitimate safety concern—mixing powered equipment with human-operated carts had incident potential.
The directive came without implementation guidance. Our shift's Operations Manager and I were tasked with figuring out how to make it work.
The Concurrent Quality Problem
My Operations Manager and I both anticipated quality issues would spike due to:
Reduced staging headcount: Fewer eyes catching errors before boxes reached conveyors
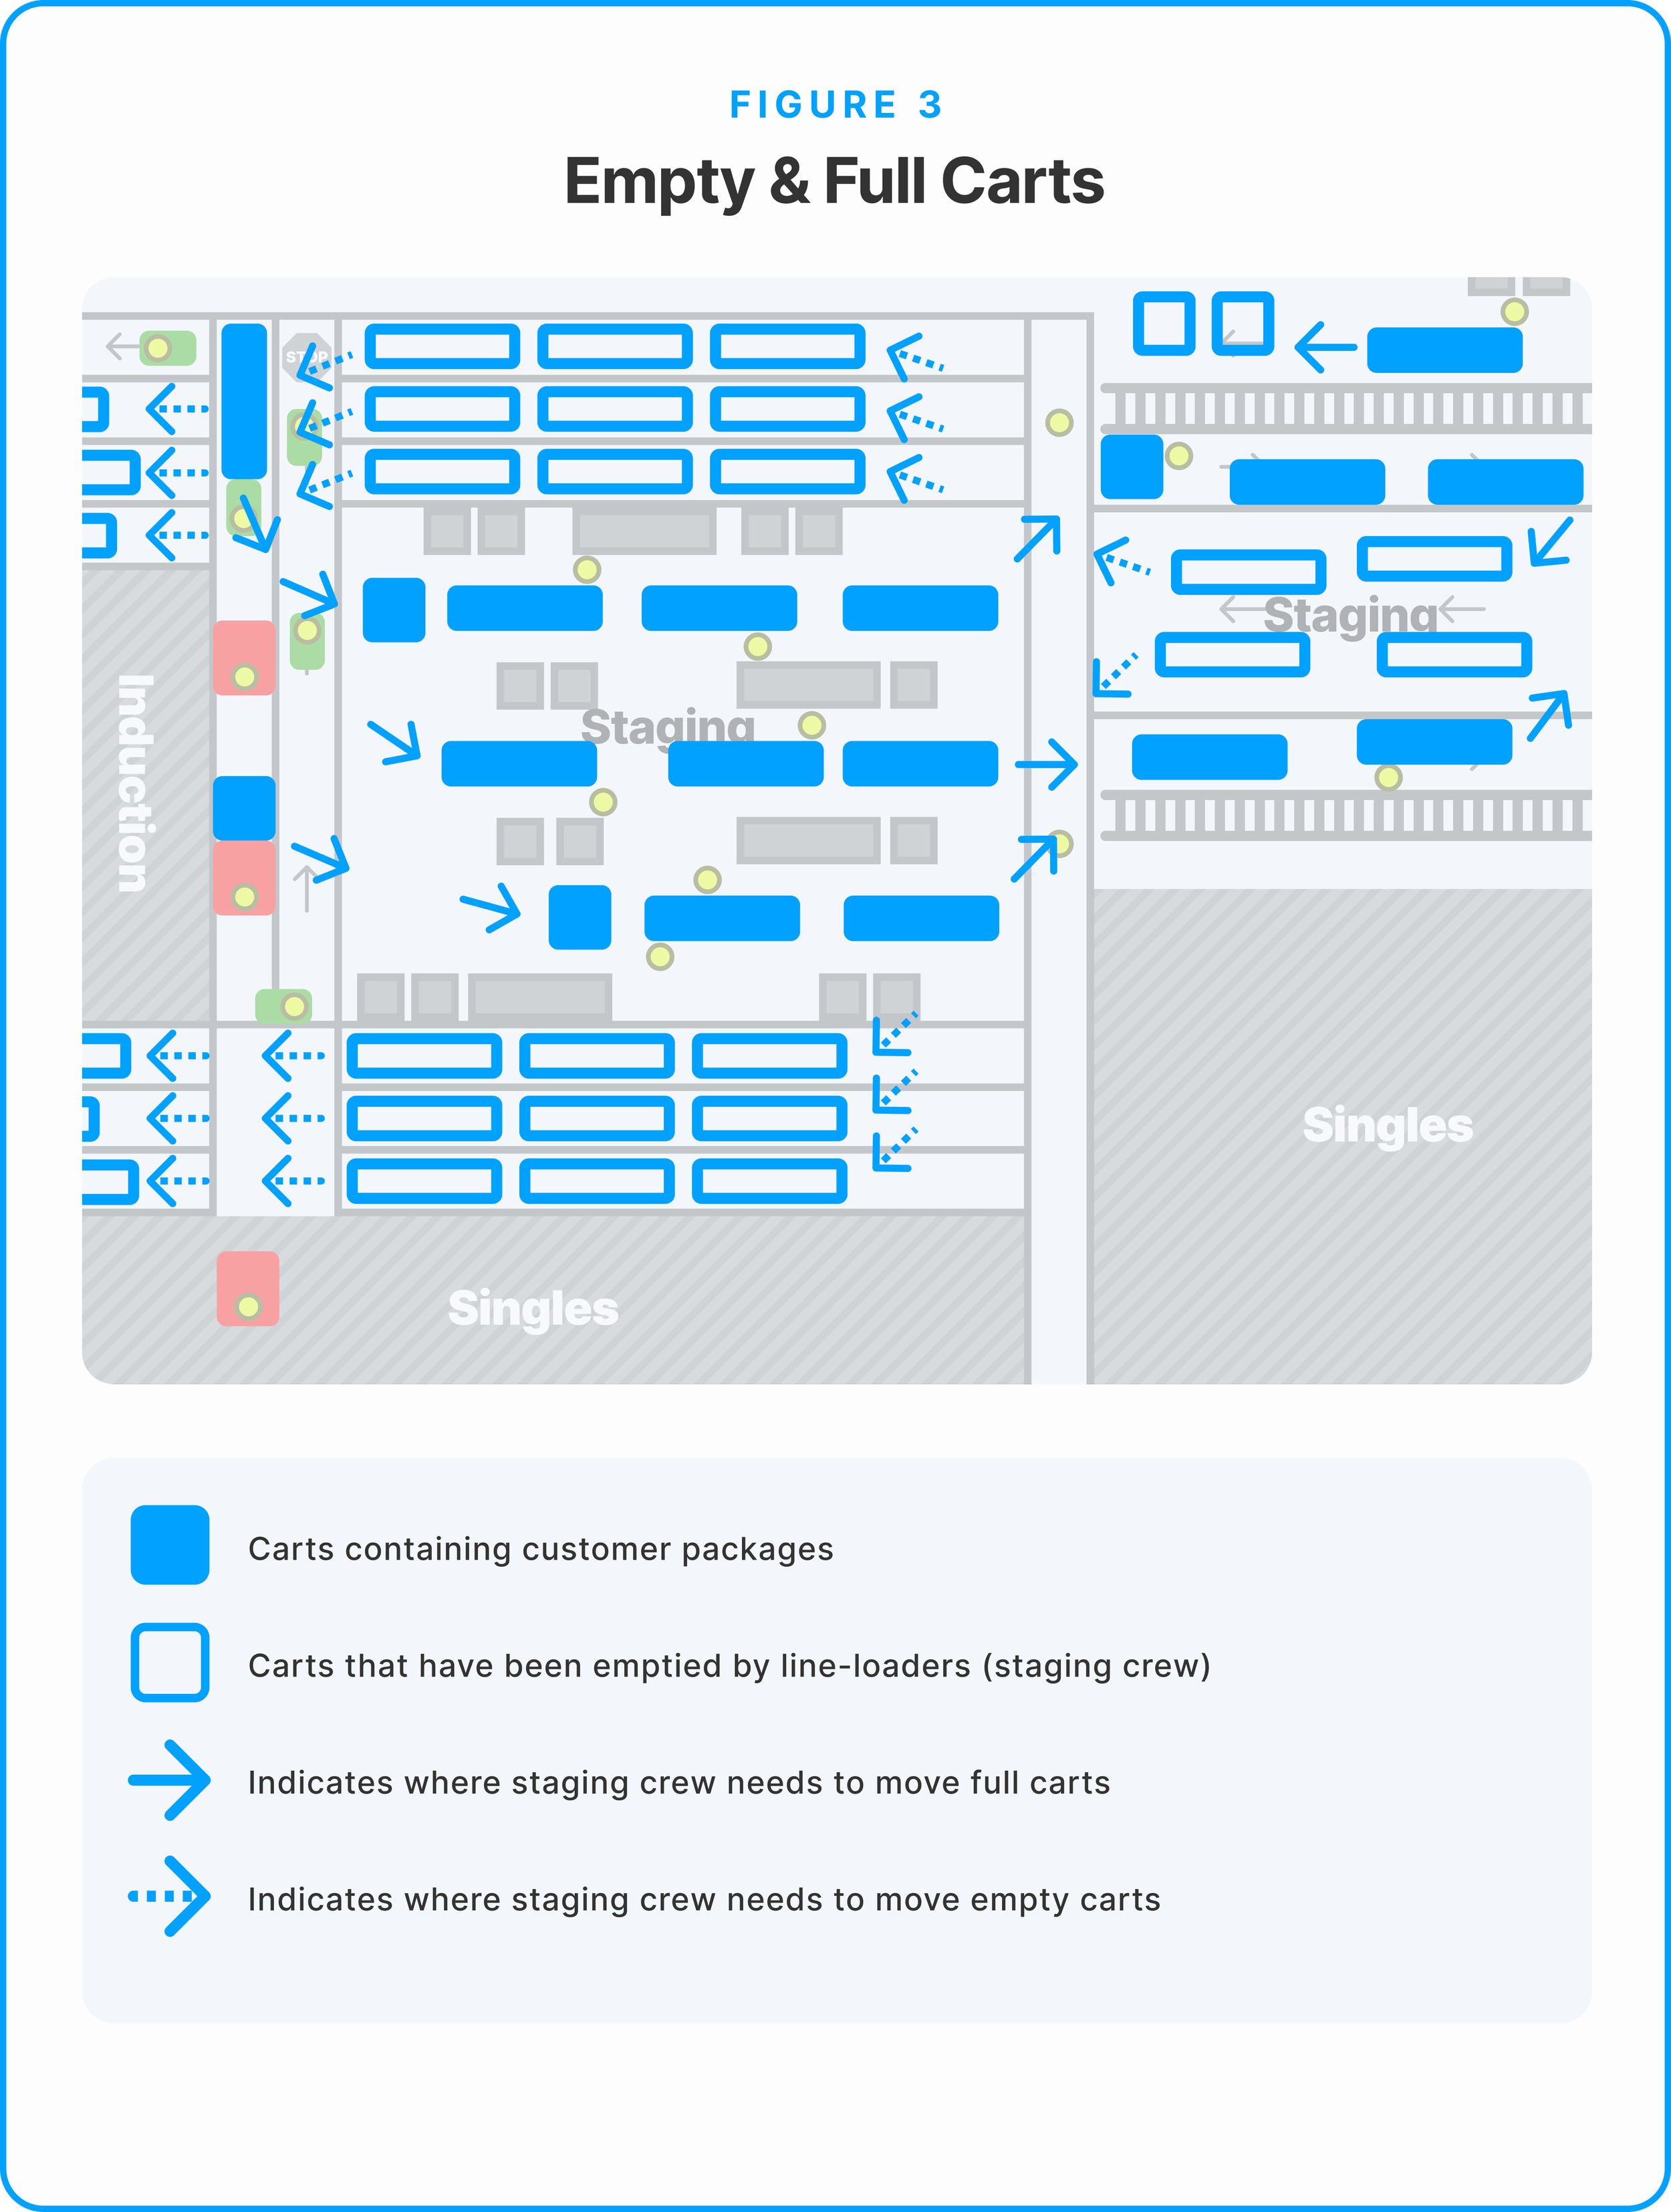
Faster box flow: Movexxes dropping carts closer to the conveyors eliminated buffer inspection time
Escalations bottleneck: Quality team audited boxes on conveyor, but staging leads didn't see results until hours later via Slack notifications
The prediction was correct. Quality dropped from ~40% passing audits to lower as team member errors increased.
The most common quality errors:
Missing slip sheets (55%
Damaged items (20%)
Incorrect items (15%)
Infested products (5%)
Improper product placement (5%)
The Stakes
If we couldn't solve this, leadership would either:
Revert to the old system (abandoning safety and throughput improvements)
Demand a full 5S tape and layout overhaul (expensive, time-consuming, still wouldn't address quality)
Affected users: 40-80 team members navigating staging daily, across 6+ functions (multis pickers, singles team, staging crew, induction crew, PK problem solver, escalations).
🔧 DESIGN PROCESS: 4 Iterations
❌ Iteration 1: Verbal Instructions (Week 1-2)
Status: Failed
What we tried: Verbal instructions at shift start about new pathways. Movexx drivers: enter from one direction, cut through the staging buffer, than exit from another. PIT operators utilize the same entrance and exit as before.
Why it failed:
Muscle memory caused team members to revert to old routes unconsciously
Not everyone present for instructions (bathroom breaks, late arrivals, mid-shift staffing changes)
System collapsed when I stepped away from staging area
What I learned: Verbal instructions aren't enough in high-volume, high-distraction environments. Information needs to be embedded in the environment itself.
❌ Iteration 2: 5S Tape Update (Week 3-4)
Status: Better but not scalable
What changed: My Area Manager and I applied new 5S floor tape marking "official" pathways. We moved can-toppers (packing crew) out of buffer area to fixed stations along conveyor, reducing headcount by ~15%.
Why it helped (but wasn't enough):
Visual cues reinforced verbal instructions
Buffer area cleared = fewer collision points
Reduced some staffing needs
Why it still failed:
Still required me to actively direct traffic entire shift
Collapsed when I left for breaks or meetings
Incomplete 5S coverage created confusion at decision points
Team members needed more than passive visual cues
What I learned: Visual cues help, but passive communication (floor tape alone) isn't sufficient. I needed proactive environmental communication.
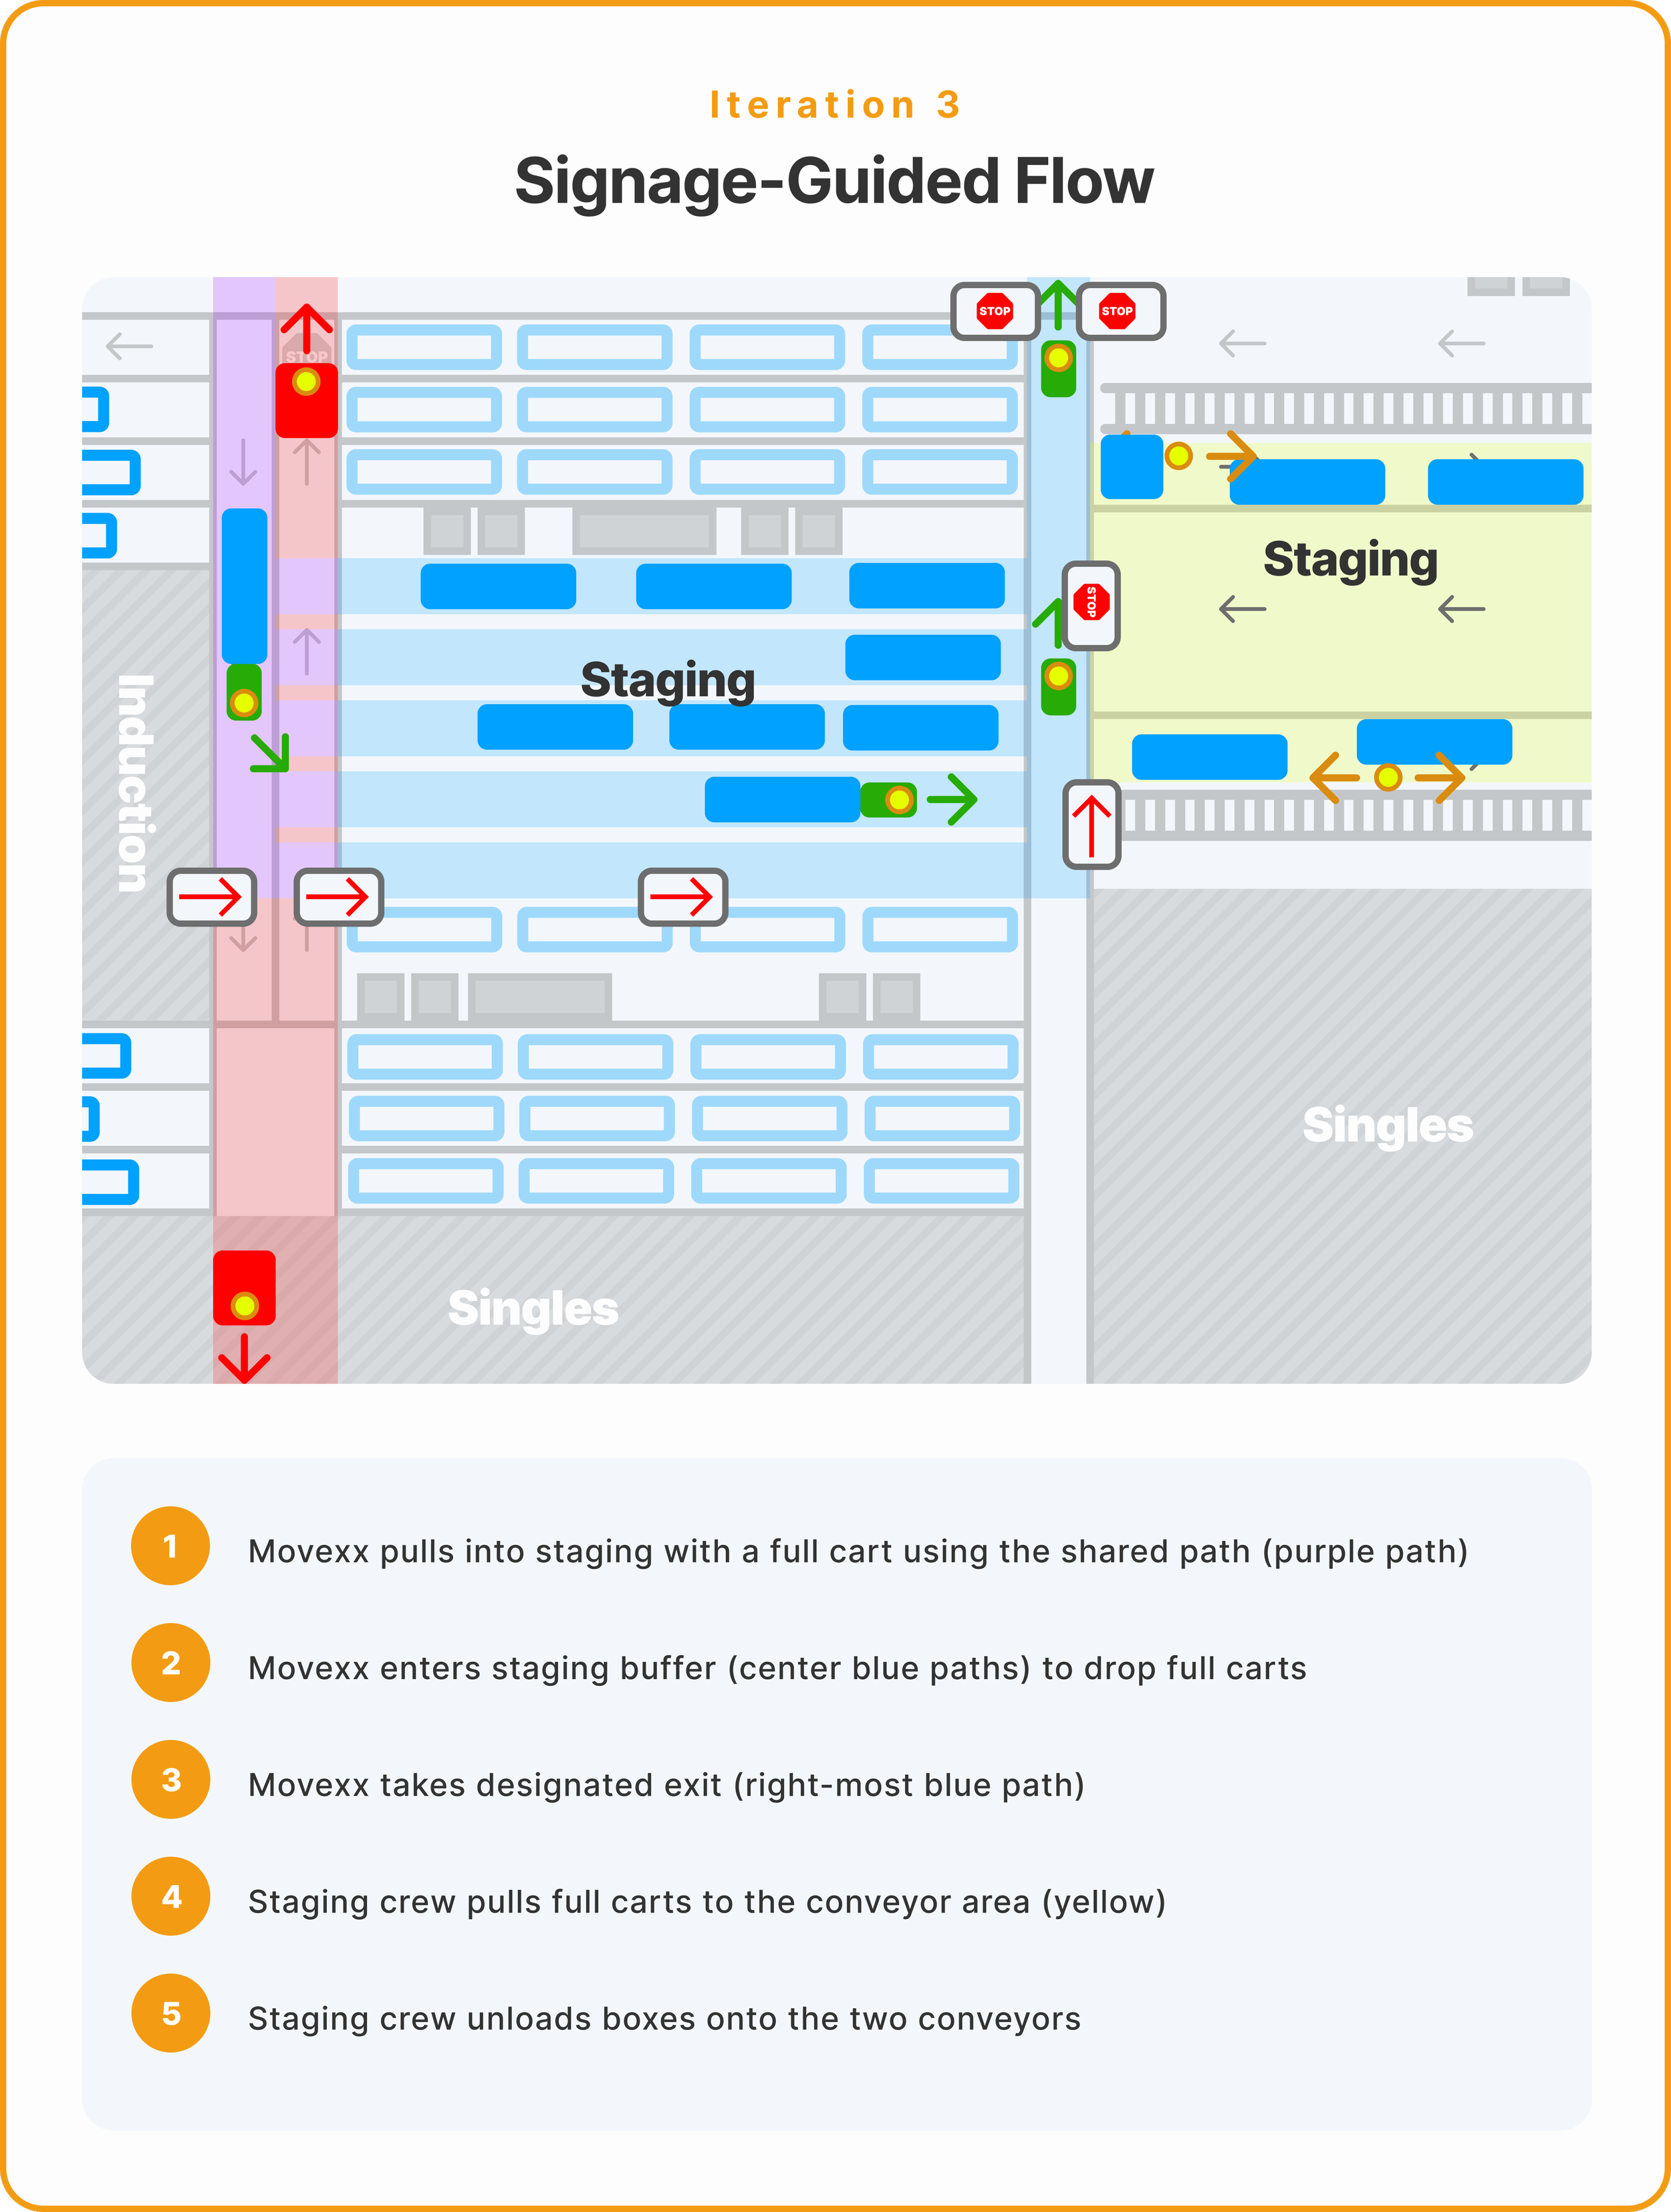
✅ Iteration 3: Strategic Signage (Week 5-8)
Status: Self-sustaining breakthrough ← MY OWNERSHIP BEGINS HERE
The insight: If I can't verbally direct every person, the environment needs to communicate for me.
What I Created
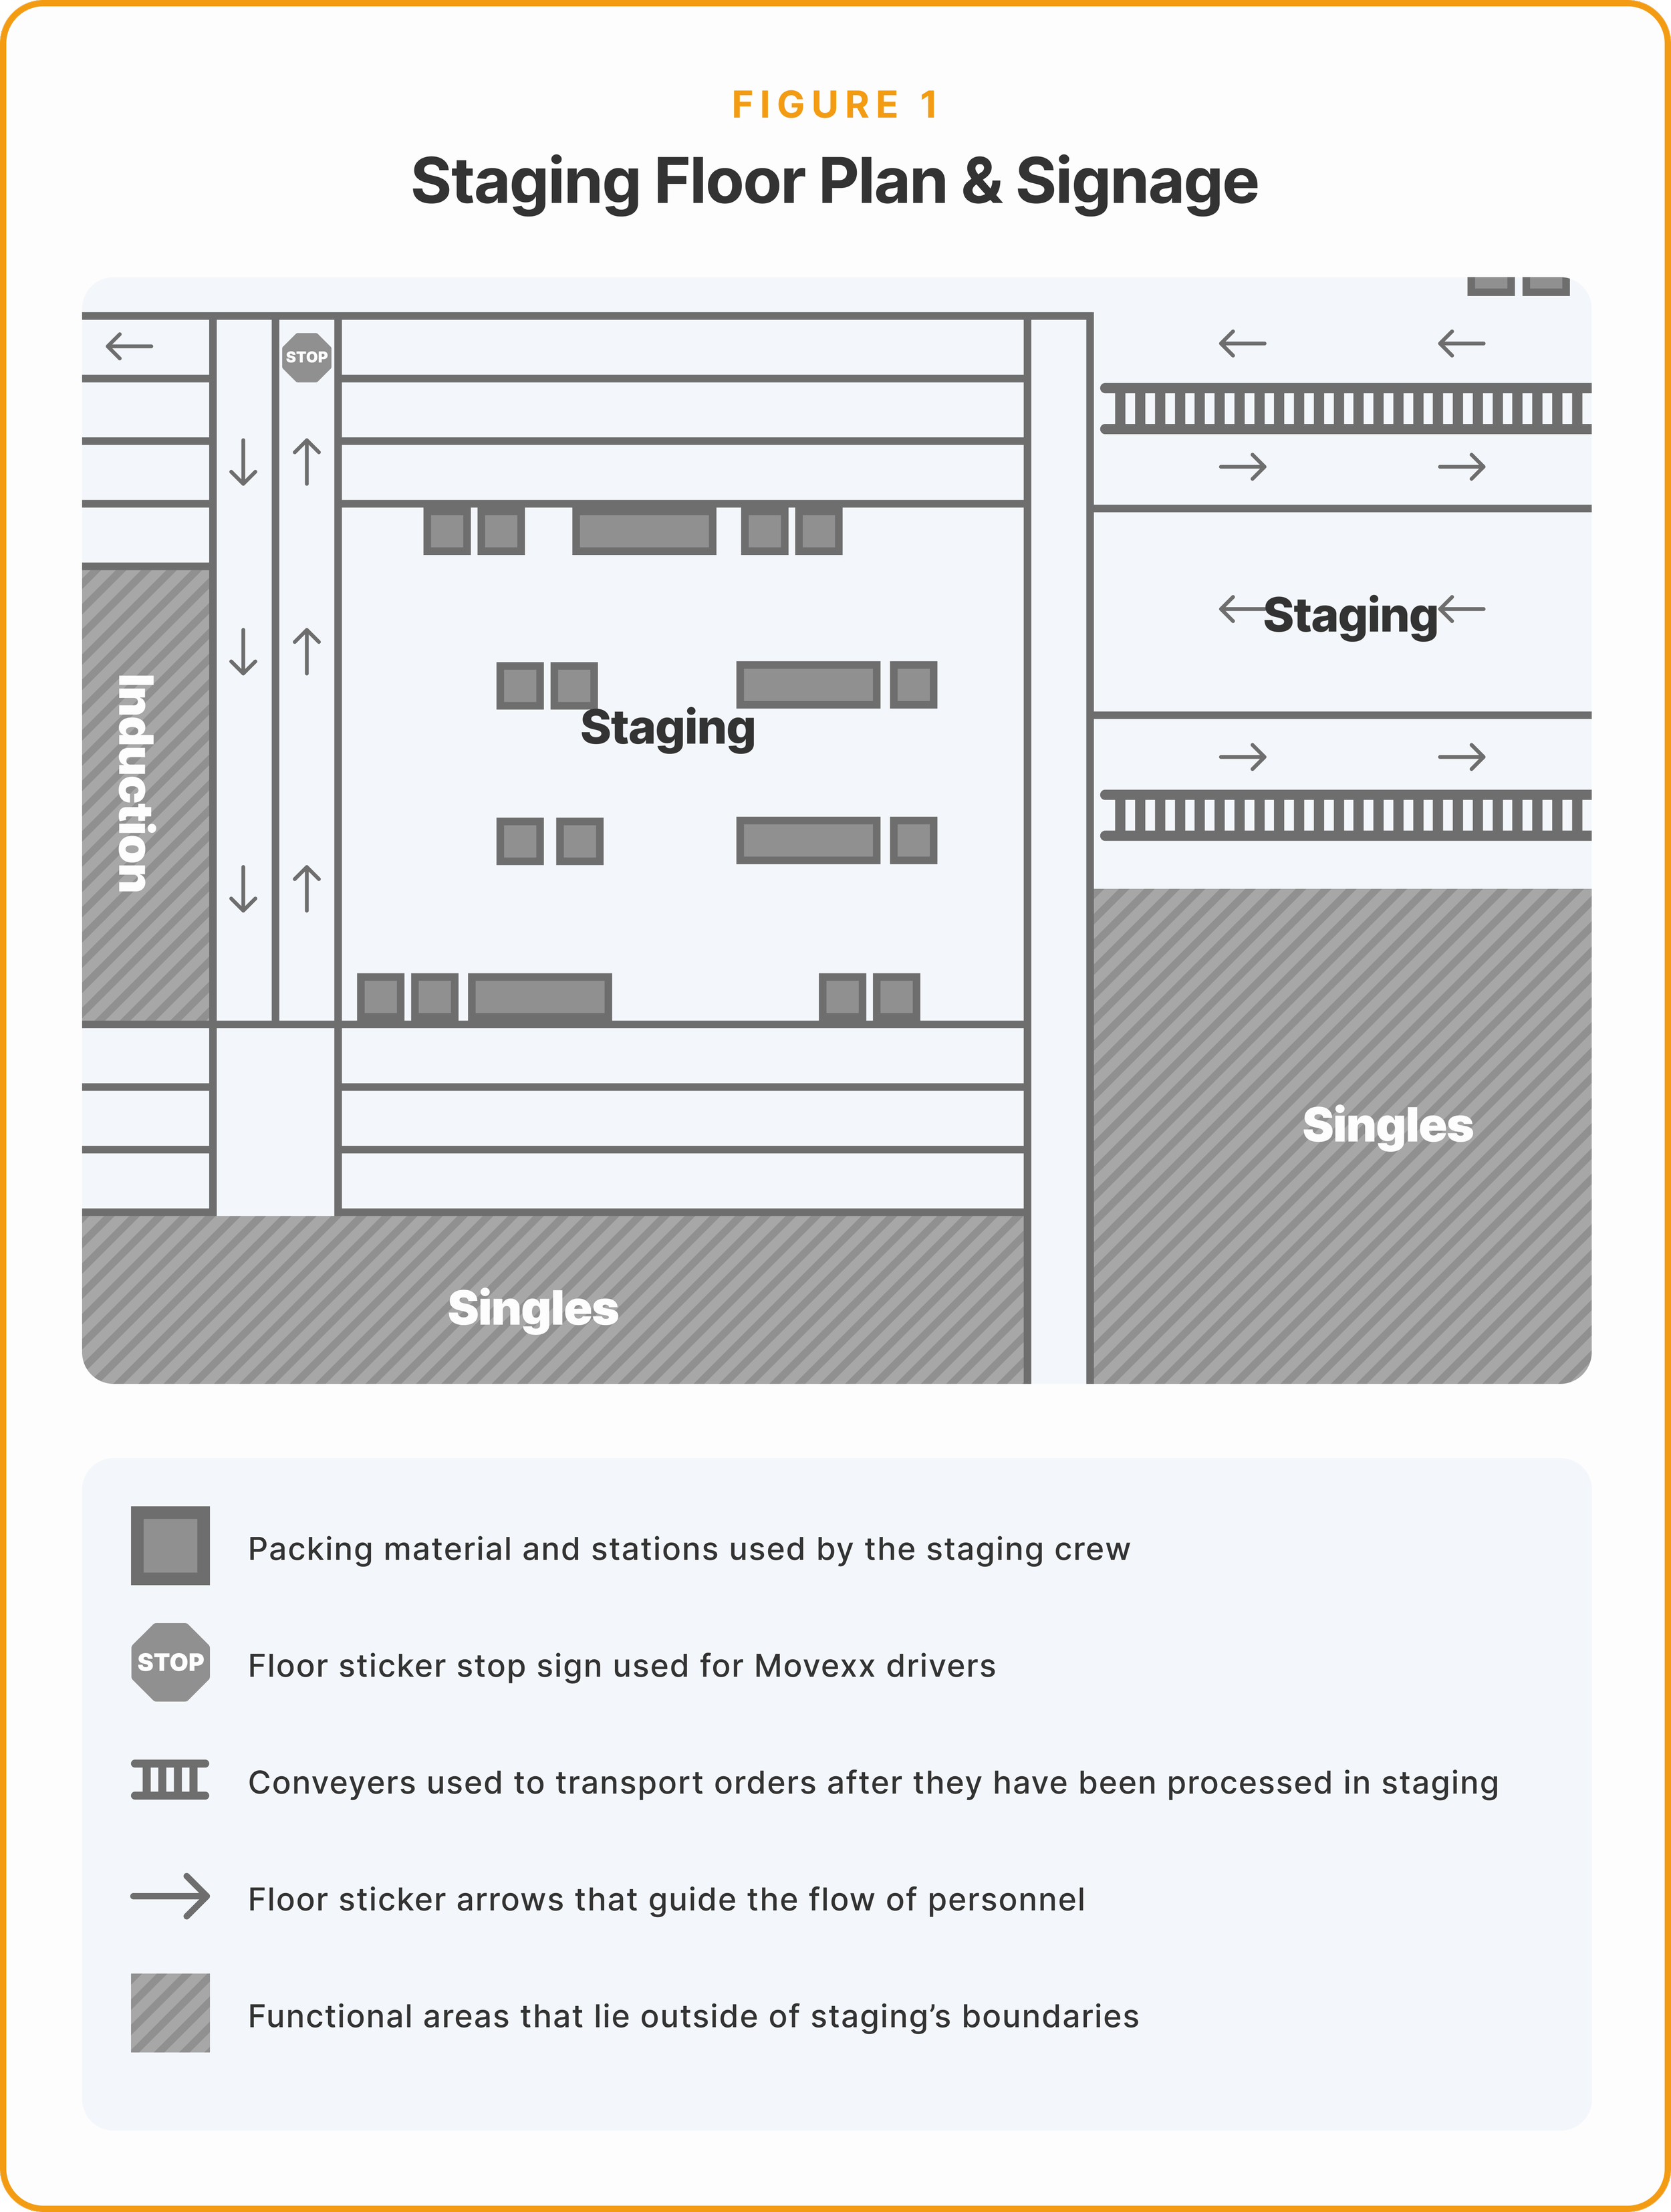
Using readily available warehouse equipment (stands, laminated paper, tape), I designed and placed two types of signage:
1. Directional Flow Signs (4 locations)
Arrow icons showing Movexx cart direction
Placed at entry points and mid-flow decision junctions
Large, visible from 20+ feet away
Decision-point placement (not in middle of obvious routes)
2. Exit Designation Signs (2 locations)
"MOVEXX EXIT →" with clear arrow
Placed where Movexes should leave staging after dropping carts
Visible as drivers complete cart delivery
Design Principles
Persistent communication: Signs "direct" traffic 24/7, even when I'm not present. Unlike verbal instructions that fade from memory or digital displays that fail, physical signage is always on.
Decision-point placement: Signs located where team members make pathway choices—entry points, junctions, exits. Not placed along obvious routes where direction is already clear.
Low-tech reliability: No digital displays to malfunction, no training required, no system dependencies. Works during power outages, WMS crashes, or any operational disruptions.
Scalable design: Easy for other shifts to replicate. Used standard warehouse equipment that every shift has access to.
Results
80% of team members followed new pathways without my intervention
System survived my absence: I could take breaks, attend sync meetings, support other areas—flow remained stable
Cross-shift adoption: Other shifts kept my signage in place (unusual—shifts typically reconfigure areas to their preferences)
Freed my time: No longer spent entire shift directing traffic, could focus on quality and team development
With flow stabilized, my Operations Manager tasked me with implementing 30+ daily quality audits to catch defects caused by faster staging throughput.
💡 WHY THIS TRANSLATES TO WMS DESIGN
Most designers building warehouse management software would propose digital signage, mobile push notifications, or in-app alerts. But I knew from living in this environment: digital systems fail during outages, drivers don't check phones mid-shift, and training on new software takes weeks to build muscle memory.
Low-tech reliability beats high-tech sophistication in 24/7 operations. This is the kind of insight you only get by being the user, not just interviewing users.
🔥 Iteration 4: Direct Conveyor Delivery (Week 9-11)
The proposal: My Operations Manager suggested: What if Movexes drive their carts ALL THE WAY to the conveyors, drop them at the conveyor edge, then exit down the middle pathway between the two conveyor lines?
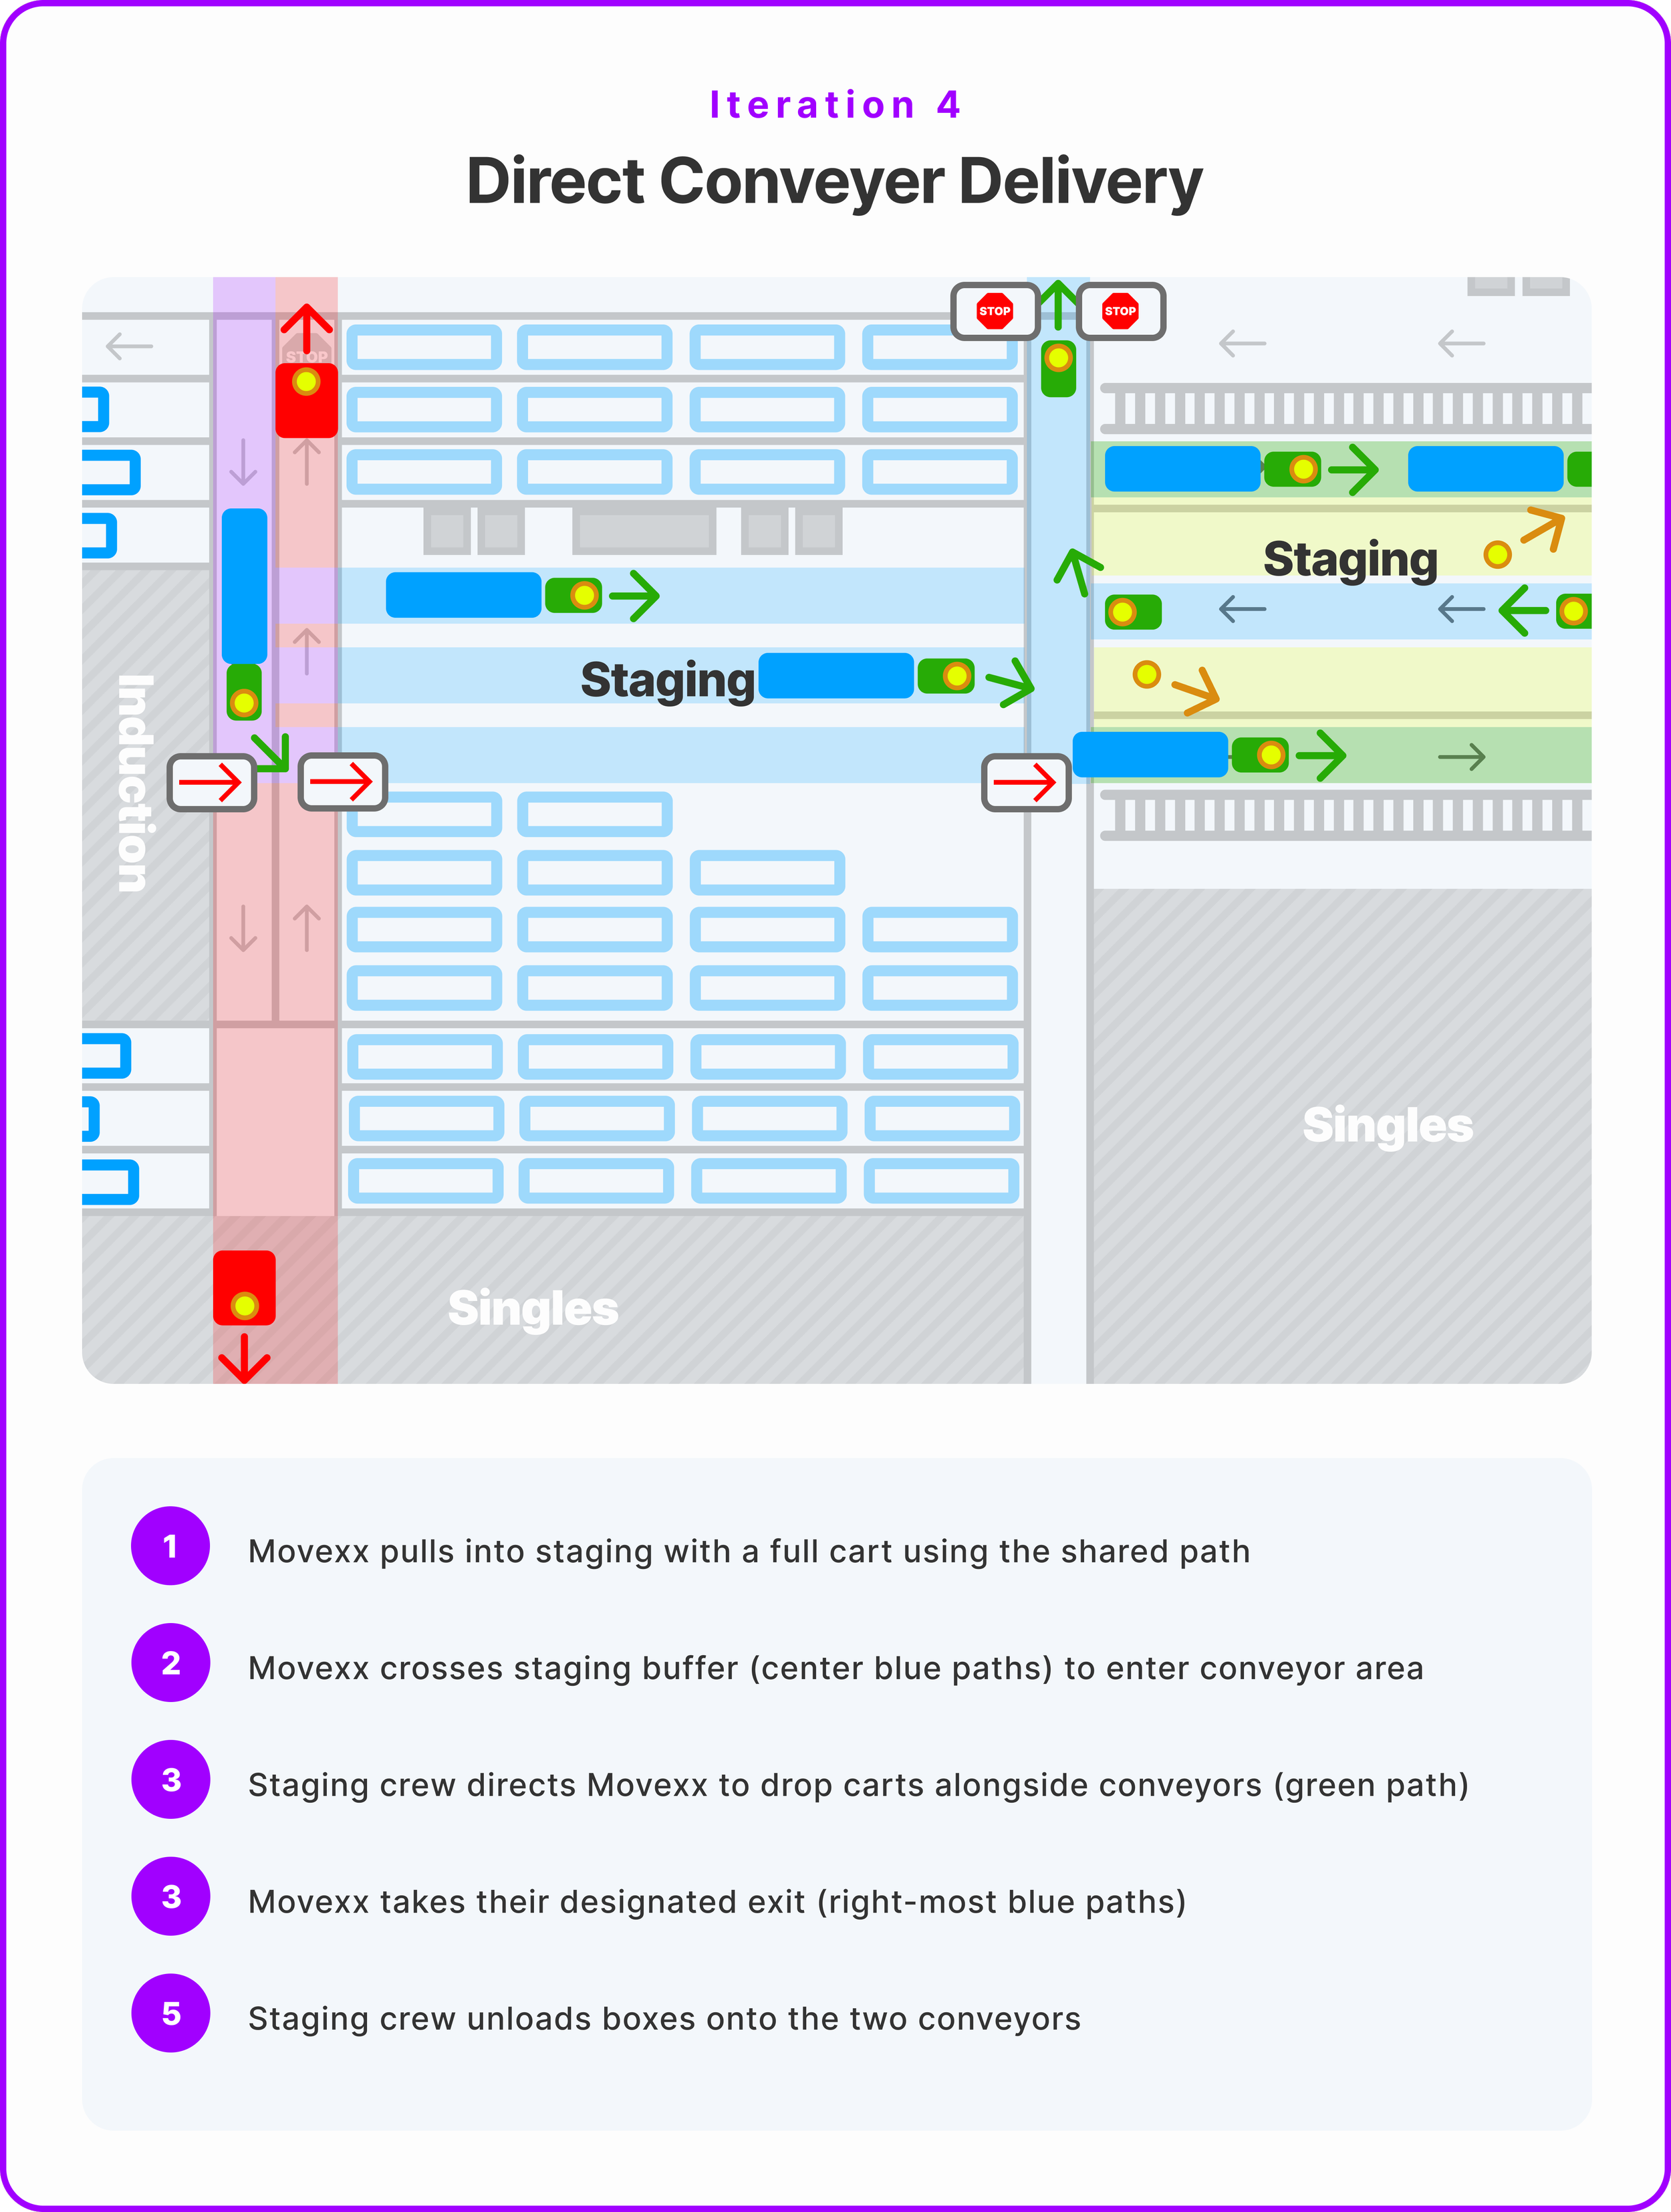
Benefits of Direct Delivery
Eliminated cart-pushing step: Line-loaders no longer wasted time and energy pushing heavy carts from buffer to conveyors. Some carts had broken wheels, making this physically strenuous.
Faster box processing: Boxes reached conveyors immediately. No wait time for staging crew to retrieve carts from buffer.
Reduced staffing needs: Enabled 33% staffing reduction (from ~12 crew → ~8 crew). Line-loaders could focus entirely on unloading boxes onto conveyors.
Increased throughput: Estimated 35% faster staging processing. Boxes moved from picker → conveyor in one motion instead of two-step process.
Safety consideration: Middle pathway between conveyors was WIDER than the aisles Movexes normally navigated. Collision risk was minimal and never occurred during three-week trial.
The Review Pause
Senior leadership put this change "in review" in late December due to perceived conveyor collision risk. My shift was instructed to revert to Iteration 3 while they deliberated.
What I proposed to address concerns (ideated in January, not implemented before departure):
Fish-eye mirrors at conveyor corners to let drivers see around blind spots
More prominent 5S tape along middle pathway to create clearer visual boundaries
Speed limit signage in conveyor zone to reinforce safe Movexx operation
I left the company on January 12, 2026 before seeing Iteration 4 approved. During the three-week trial, it significantly improved our shift's throughput (TPH) and was the most efficient staging configuration we achieved.
🎯 THE SOLUTION: QUALITY AUDIT SYSTEM
Why Existing Quality Process Failed
Escalations' limitations: Quality team audited boxes on conveyor (after leaving staging), provided no picker attribution, sent results hours later via Slack
Delayed feedback loop: Staging leads saw quality issues 4-8 hours after they occurred. Too late for real-time correction.
No individual accountability: Audits showed "staging quality issues" but not which picker made the error. Made targeted coaching impossible.
FPY engagement requirements: Each shift mandated 15 First Pass Yield engagements (7 multis, 5 singles, 3 replen). Needed faster way to meet quotas.
My Constraints
Had to audit 30+ carts per shift minimum to meet FPY requirements
Couldn't slow down staging throughput (volume was increasing with traffic flow improvements)
Needed team member attribution (which picker packed which cart) for targeted coaching
Had to be sustainable during high-volume shifts with emergencies and staffing fluctuations
Audit Evolution: Three Approaches
Version 1: Container Audits (Operations Manager's Original Method)
Process: Scan each individual box barcode/LP → Manually enter team member name from badge → Fill out Smartsheet form per box
Problem: 3-4 minutes per audit × 30 audits = 90-120 minutes. Unsustainable. Required wheeling computer cart into heavy traffic.
Version 2: Cart Audits (My First Refinement)
Process: Audit entire cart (not individual boxes) → Enter team member name + issues in simplified Smartsheet → Reduced computer cart time in staging
Problem: Still spent 60+ minutes auditing, still impeded traffic flow. Better than v1 but not sustainable long-term.
Version 3: Batched Audits (Final System - MY DESIGN)
The breakthrough: Separate data collection from data processing. Collect fast, process during downtime, batch-enter at end of shift.
The Batched Audit Process
Phase 1: Rapid Collection (First 1-2 hours of shift)
Inspect carts as they arrive in staging
Write barcode/LP on paper with two columns: "Passed" / "Failed"
No computer needed, no traffic obstruction
Visual inspection only: damaged items, missing slip sheets, improper placement
Goal: Collect 30-40 LPs/barcodes in ~1 hour
Phase 2: Rapid Collection (First 1-2 hours of shift)
Use Korber One WMS to scan collected barcodes
Look up transaction history (identifies which picker packed the cart)
Label paper with team member username + specific fail type
Categories: Damaged item, Missing item, Incorrect item, Infested product, Improper placement, Missing slip sheet
Phase 2: Rapid Collection (First 1-2 hours of shift)
Manually enter all 30-40 audits into Smartsheet cart audit form
Takes ~15-20 minutes total (vs. 90-120 min for real-time entry)
Smartsheet data automatically flows to Tableau for FPY tracking
Ready for next-shift handoff
Why Batched Audits Worked
Fastest collection: Paper + visual inspection = 30-45 seconds per cart. 10x faster than v1, 4x faster than v2.
Reduced staging disruption: Only physically present in staging for ~1 hour (vs. 3+ hours in previous versions). Minimal traffic impact.
Maintained accuracy: WMS lookup ensured correct team member attribution. No guessing, no badge-checking during busy periods.
Batch efficiency: Entering 30+ audits in one session faster than 30 individual entries. Muscle memory for form fields, no context switching.
Met FPY requirements: Smartsheet audits automatically counted as concessions for engagement tracking. Guaranteed 15+ engagements per shift.
💡 THE BATCHED AUDIT PATTERN IN SOFTWARE DESIG
In operational UX, separating data collection from data processing often unlocks massive efficiency gains. Users can capture information quickly in the moment (when context is fresh), then batch-process it during natural downtime.
Real-time data entry isn't always the right answer. This same principle applies to WMS design—let pickers scan barcodes quickly on the floor, process quality checks during breaks, submit in batches. Optimize for operational flow, not just data completeness.
Real-Time Coaching Framework
The batched audit system created audit records, but behavior change required immediate coaching.
For first-time issues:
Immediate, friendly coaching: "Hey, I noticed this cart had a missing slip sheet. Let me show you proper placement."
Real-time correction means team member can SEE the specific box/cart I'm referencing. Context is fresh, learning is immediate.
Educational tone: "This is why slip sheets matter—prevents items from crushing during conveyor transport and shipping."
For repeat issues:
Hands-on teaching: Walk through their picking process step-by-step, identify where error occurs
Extra supervision: Audit their next 3-5 carts to verify improvement and reinforce correct behavior
Accountability without punishment: "I know you can do this. What barriers can I help remove?"
For persistent problems:
Slack escalation: Tagged managers with pattern documentation (e.g., "5 failed audits in 2 weeks, all missing slip sheets")
Formal engagement: Operations Manager one-on-ones (developmental focus, not punitive)
Performance documentation: Patterns used for performance reviews if misconduct continued
Why Real-Time Coaching Worked
Immediate context: Team member remembers the specific cart they just packed, can visualize the error
Reduced defensiveness: Can't claim "someone else packed that" or "I was going to fix it later" when caught in staging (final processing stage)
Faster behavior change: Correction happens within minutes of error, not hours or days later via Slack notification
Visible accountability: Other team members saw audits happening throughout shift. Peer pressure effect reinforced expectations
Perceived leadership support: Staging is most visible area in warehouse (right in front of management office). Audits conducted publicly signaled shift-wide priority
📊 IMPACT & OUTCOMES
Flow Optimization Results
33% staffing reduction — Reduced staging crew from ~12 to ~8 (enabled by Iteration 4 efficiency gains)
35% faster throughput — Boxes processed significantly faster with direct conveyor delivery
4 iterations over 2 months — Rapid problem-solving with measurable improvements each cycle
Self-sustaining system — Iteration 3 signage remained in place across all shifts, even after my departure
Cross-shift stability: My signage stayed up (unusual—shifts typically reconfigure areas to their preferences). System proved sustainable without my constant presence.
Buffer area stayed clear: No cart pileups, reduced collision zones, improved overall staging flow
Lead time freed: Staging leads no longer spent entire shift directing traffic, could focus on quality, coaching, and cross-area suppor
Quality Control Results
58% improvement in quality pass rate — From 40% passing audits → 63% passing
30-40 audits per shift — Averaged 35 daily cart audits, exceeding FPY minimum requirements
100-115 unique team members audited weekly — Guaranteed every multis picker audited at least once per week
Prevented estimated 15-20% of customer concessions — Based on 58% quality improvement, conservative estimate accounting for variables beyond staging control
Audit coverage rate: 30-40 carts/shift out of ~124 total carts = 25-32% daily audit rate. High enough for accountability, fast enough to be sustainable.
Targeted improvement: Repeat offenders audited more frequently (every 2-3 shifts vs. weekly), accelerated behavior change
Pattern visibility: Tableau dashboards showed quality trends by picker, shift, day of week. Enabled data-driven coaching conversations.
Timeline to Results
Week 1-2 (Iteration 1): Chaos phase, verbal instructions failing, quality dropping
Week 3-4 (Iteration 2): 5S tape added, slight improvement but still required active directing
Week 5-8 (Iteration 3): Signage breakthrough, system became self-sustaining, quality audits introduced
Week 6: Quality pass rate climbing toward 63% target
Week 9-11 (Iteration 4): Peak efficiency, 33% staffing reduction enabled
Week 12: Iteration 4 paused for senior leadership review, reverted to Iteration 3
Qualitative Outcomes
For team members:
Reduced confusion navigating staging (80% followed pathways without intervention)
Clearer expectations around quality (knew audits were happening daily)
Faster cart drop-offs = improved pick rates (UPH) in multis area
For operations leadership:
Visible quality improvements in Tableau FPY reports (58% improvement)
Met engagement requirements organically (30-40 audits guaranteed 15+ FPY engagements)
Reduced customer complaints (fewer defects reaching customers)
For downstream operations (docks area):
Fewer quality issues = fewer jams and operational freezes
Faster staging = more boxes available for dock workers to ship
Better-packed boxes = safer truck loading, reduced damages in transit
💡 LEARNINGS & REFLECTIONS
What I'd Do Differently
Earlier documentation: If I could go back, I'd document each iteration with:
Before/after photos of signage placement and traffic flow
Weekly quality score trends showing 40% → 63% progression
TPH (throughput per hour) improvements per iteration
Team member feedback quotes from each phase
This formal documentation would have:
Secured faster senior leadership buy-in for Iteration 4
Created stronger case study material for portfolio
Demonstrated clear ROI for future warehouse redesign projects
Proactive senior leadership communication:
Iteration 4's "in review" status might have been avoided if I'd:
Sent weekly progress updates to senior leadership (not just operations manager)
Included safety data (zero conveyor collisions during three-week trial)
Framed efficiency gains in business impact terms (cost savings from 33% staffing reduction)
Addressed perceived risks preemptively with proposed safety enhancements
Key Insights for Designing Operational UX
1. The environment is the interface.
Digital UX designers think about buttons and navigation menus. Operational UX designers think about floor tape, signage placement, and spatial flow. Both are "interfaces" communicating how users should behave.
Physical space constraints aren't limitations—they're design opportunities. The warehouse layout informed my signage placement strategy. The conveyor width informed Iteration 4's safety profile.
2. Visibility is a design feature, not just a constraint.
Staging was the MOST visible area in the warehouse (directly in front of management office). I leveraged this intentionally:
Public audits created peer accountability (other team members saw quality enforcement)
Leadership presence reinforced system authority (managers nearby when I conducted audits)
Visibility ensured sustainability (hard to abandon a system everyone sees working)
In software design: Make important features visible by default, not buried in settings. Visibility drives adoption and sustained usage.
3. Batch operations > real-time processing when possible.
My batched audit system was 3x faster than real-time Smartsheet entry. In operational design, separating data collection from data processing often unlocks massive efficiency gains.
This principle applies to any enterprise software: Let users capture information quickly in the moment (when context is fresh), then batch-process during natural downtime. Optimize for operational flow, not just data completeness
4. Design for absence.
A system that requires constant supervision isn't sustainable in 24/7 operations. My signage worked because it functioned when I wasn't there—during breaks, meetings, or when supporting other areas.
The best operational systems are the ones that work without the designer in the room. This is critical for any product serving distributed teams or round-the-clock operations.
💡 DESIGNING FOR ENTERPRISE OPERATIONS
External designers building warehouse software miss three critical things:
1. Physical space IS interface design. Floor layout, signage placement, equipment flow—these aren't constraints, they're the primary interface in operational environments.
2. Visibility determines sustainability. If leadership can't see it working, it won't survive organizational pressure. Public adoption reinforces system legitimacy.
3. The best system works when you're not there. Constant supervision doesn't scale. Design for distributed teams, shift changes, and 24/7 operations.
These aren't just warehouse principles—they're fundamental to designing any enterprise operations software.
Service Design — Mapping multi-stakeholder ecosystem (40-80 daily users across 6 departments)
Iterative Design — 4 major iterations across 2 months based on real-world feedback and operational constraints
Systems Thinking — Understanding how traffic flow impacts quality impacts customer experience impacts business costs
Behavior Change Design — Using environmental cues (signage) and real-time coaching to drive measurable performance improvements
Operational UX — Designing for physical space constraints, 24/7 operations, and non-digital touchpoints
Data-Driven Design — Using quality metrics, audit coverage, and throughput data to optimize processes
Lean Principles — Eliminating waste (cart-pushing step), increasing flow (35% throughput improvement), continuous improvement
Change Management — Navigating senior leadership review process, securing cross-shift adoption, managing stakeholder concerns
Constraint-Based Creativity — Achieving significant results with minimal budget (signage, paper, existing warehouse equipment)
Most importantly: I designed for a system I intimately understood because I worked in it daily. I was the user, the team lead, and the designer simultaneously—giving me insights external consultants would take months to uncover.